Projects
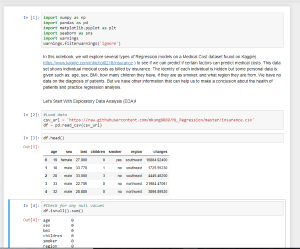
Medical Insurance Charge Regression Modeling
In this notebook, we will explore several types of Regression models on a Medical Cost dataset found on Kaggle( https://www.kaggle.com/mirichoi0218/insurance ) to see if we can predict if certain factors can predict medical costs. This data set shows individual medical costs as billed by insurance. The identity of each individual is hidden but some personal data is given such as: age, sex, BMI, how many children they have, if they are as smoker, and what region they are from. We have no data on the diagnosis of patients. But we have other information that can help us to make a conclusion about the health of patients and practice regression analysis.
View Project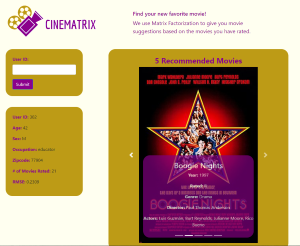
Movie Recommender App
This app recommends movies using Matrix Factorization machine learning. The Matrix Factorization model will find similarity between movies (based on how they are rated by users) and user similarity (based on how similary users rate the same movie). The model then uses these similarities to predict how a user may rate movies. A python script is written to grab each user's top 5 recommneded movies. A Flask app is used to display the top 5 recommended movies for the selected user id. An api is used to grab information on each of the recommended movies.
View Project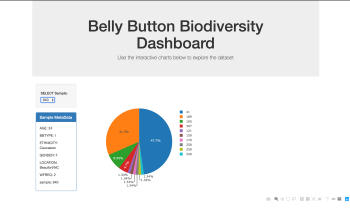
Belly Button Diversity Dashboard
An interactive dashboard visualizing belly button diversity data from Rob Dunn Lab (http://robdunnlab.com/projects/belly-button-biodiversity/). This is a Flask app that accesses belly button data stored in an sqlite file. JavaScript is used to populate the dropdown options so user can select which sample ID to visualize. Plotly.js is used to create pie and bubble chart.
View Project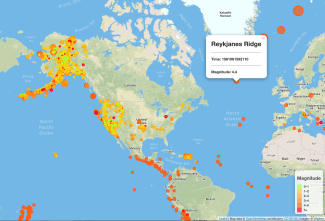
Earthquake Map
An interactive app that shows where earchquakes have occured. Each marker varies in radius and color, depending on earthquakes' magnitude. When a marker is clicked, a popup appears showing additional information about the earthquake. (Data source: http://earthquake.usgs.gov/earthquakes/feed/v1.0/geojson.php) This project uses: Leaflet, JavaScript, geoJson, HTML, CSS
View Project